Golf Course Maintenance
Precision course mapping and vegetation stress data for the people who manage turf for a living — not a scenic flyover for the clubhouse wall.
Course conditions change week to week, and eyeballing a fairway from the cart path only tells you so much. We combine multispectral imaging with precision course mapping to give superintendents a clear, current picture of turf condition and course geometry.
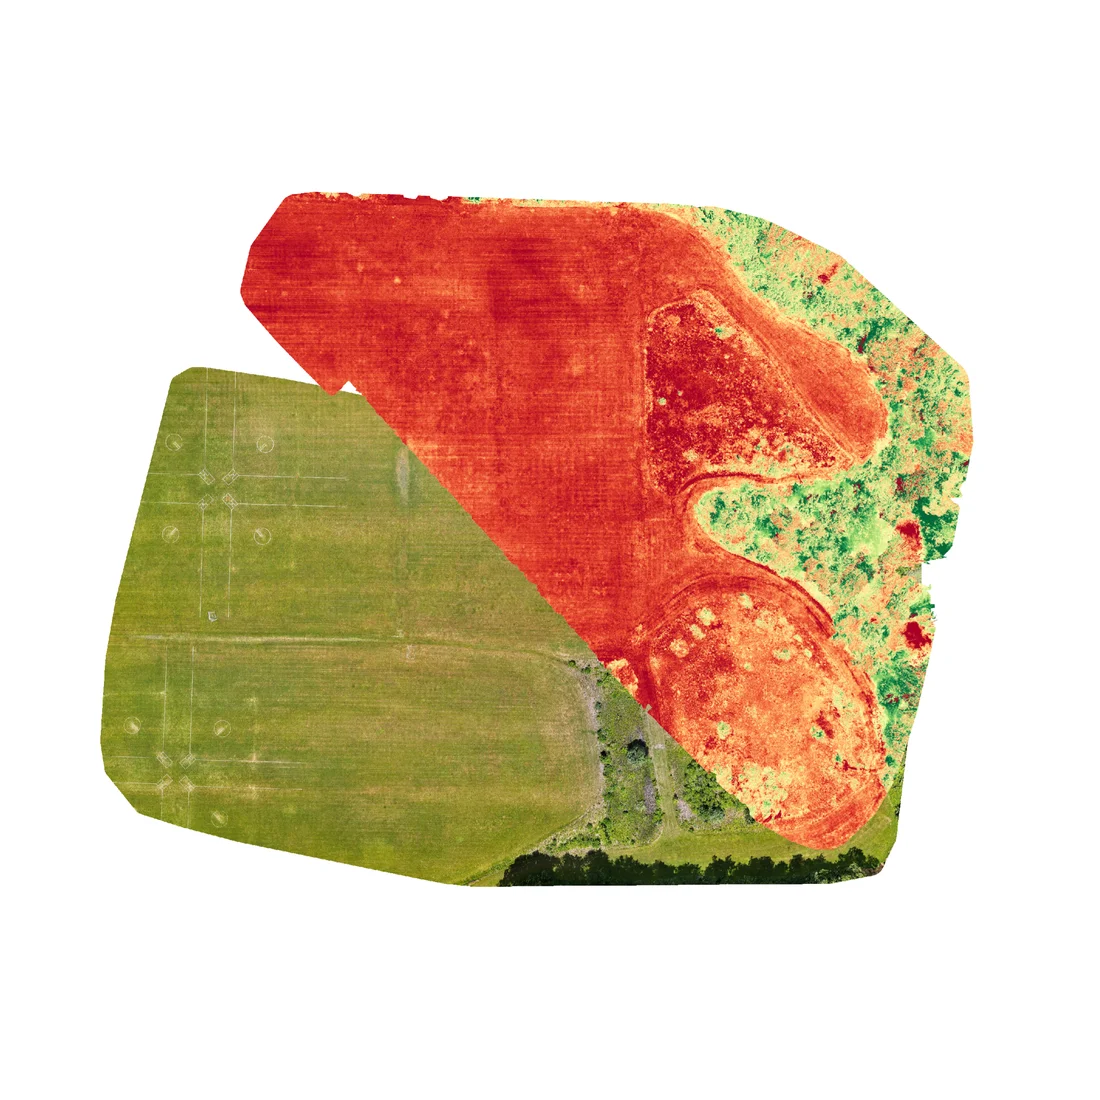
A vegetation stress index across greens, fairways, and rough, plus drainage and standing-water detection — the kind of view that flags a problem area before it’s visible from the ground.
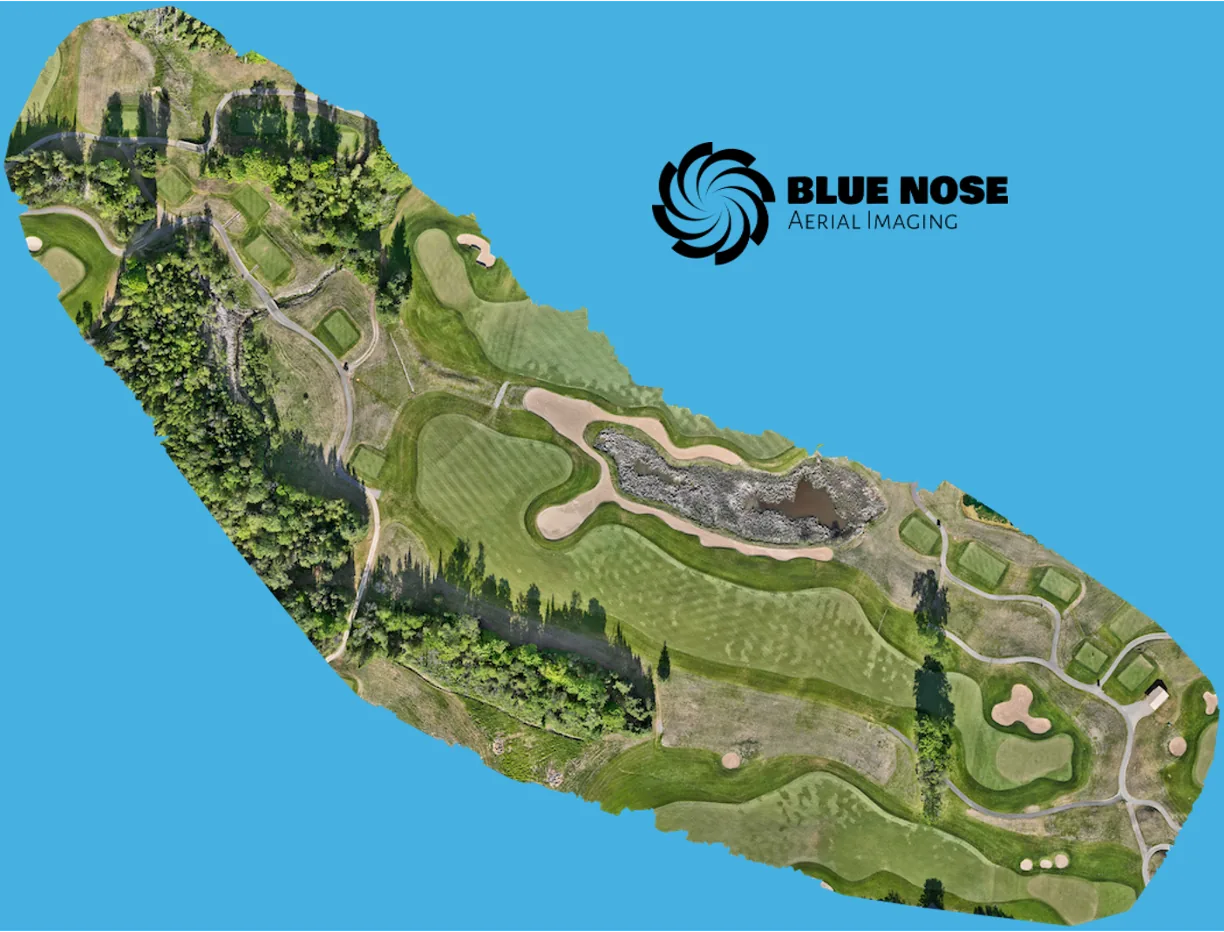
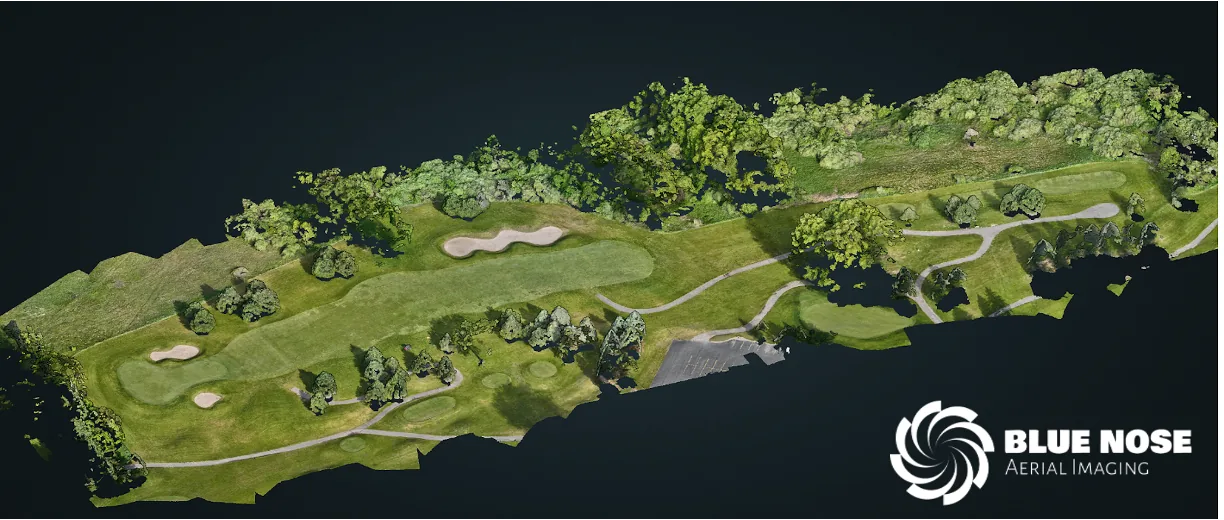
A full orthomosaic and 3D mesh model of the course, useful for maintenance planning, irrigation review, and course documentation.
Every green’s surface broken into slope percentage and fall-line direction, so the reads a player’s eye misses — a false front, a hidden shelf, a fraction of a percent of fall — are visible before anyone steps on the green.
Turf Health Mapping
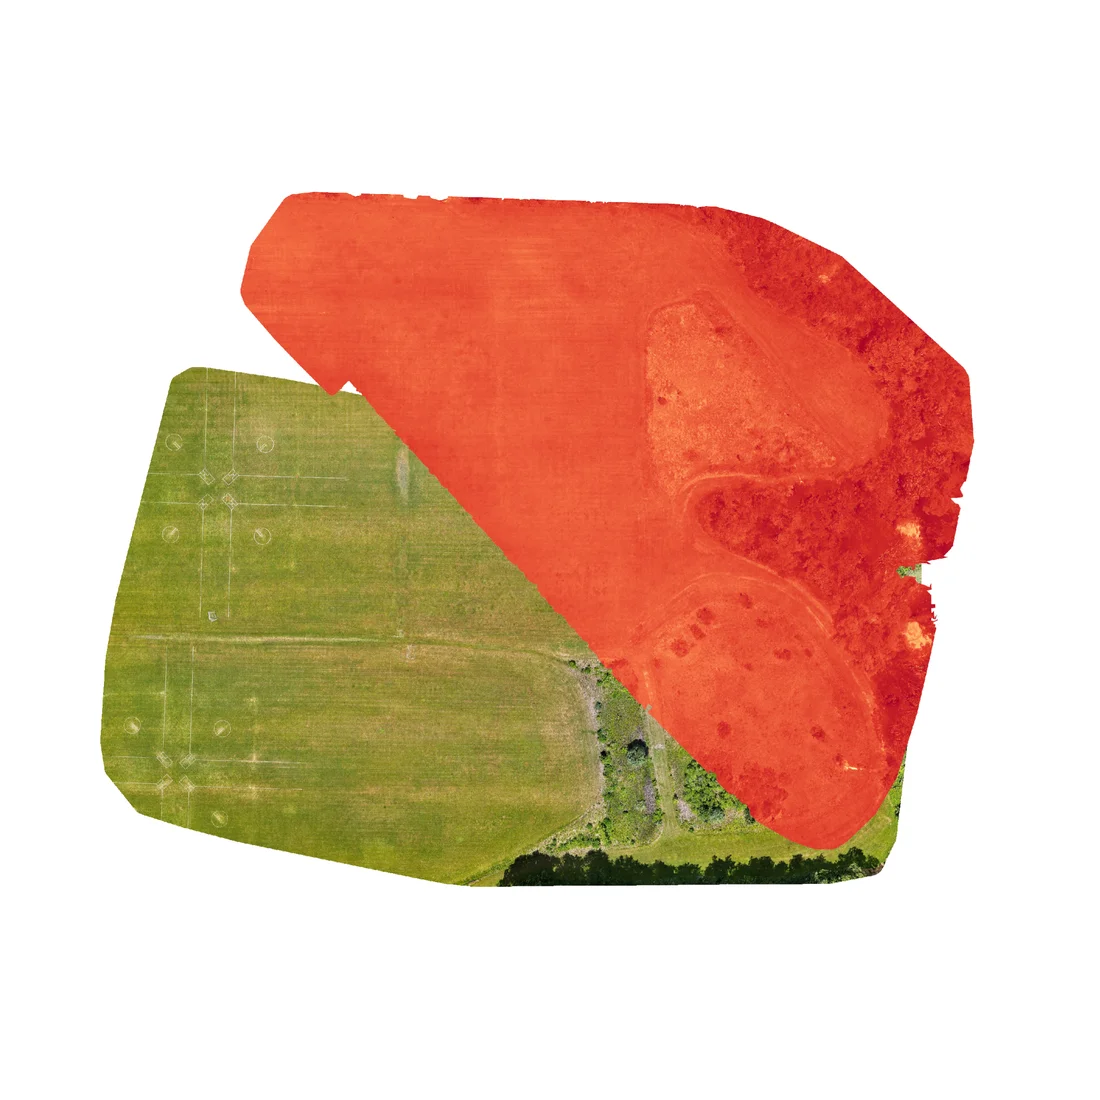
Each composite below is the same flight, shown two ways — a plain RGB half next to a computed vegetation- or water-index half. It’s the same case as the green break maps below: a photo tells you what’s there, an index tells you what’s wrong before it’s visible to the eye.
Green Break & Slope Mapping
Most golf photography stops at pretty. On its own, a straight-overhead shot of a green reads flat and even — which is exactly the problem with judging a green by eye. Run through elevation analysis instead, every color band becomes a slope percentage and every arrow the direction a ball actually breaks at that point.
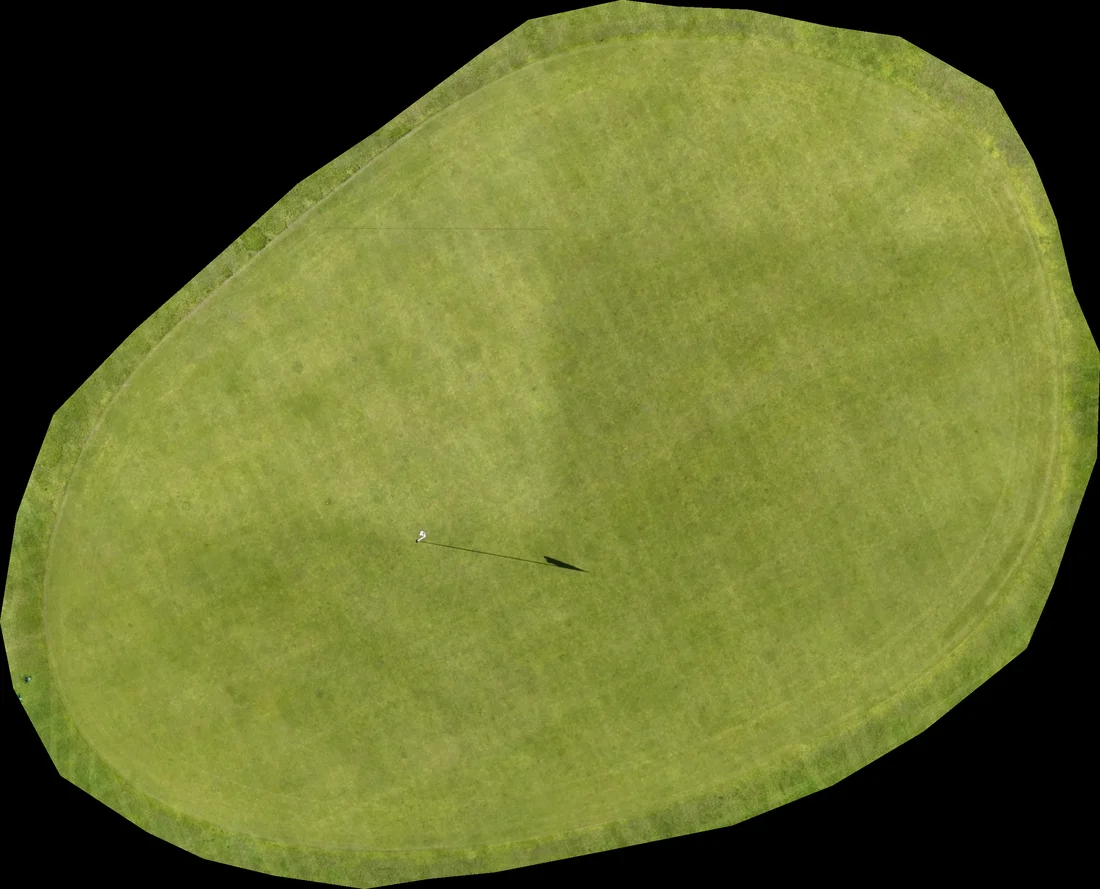
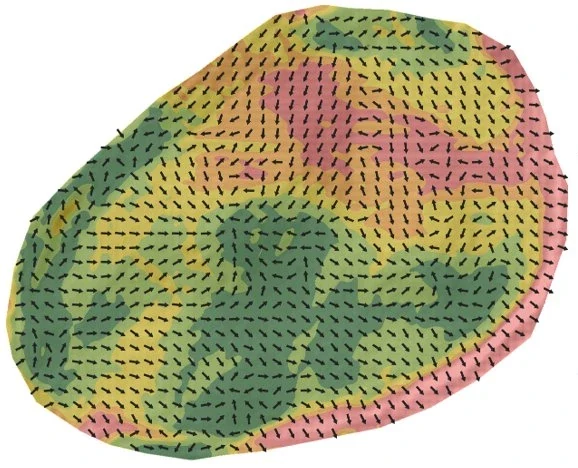
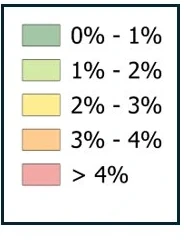
The map on the right isn’t a hand-drawn interpretation of a few spot-checked points — it’s built from a complete elevation model of the entire putting surface, so a false front or hidden shelf between where two spot checks would have landed can’t get missed. And because it comes from a data flight rather than a survey crew, a green can be remapped every season for a fraction of the cost of a repeat survey.
Watershed
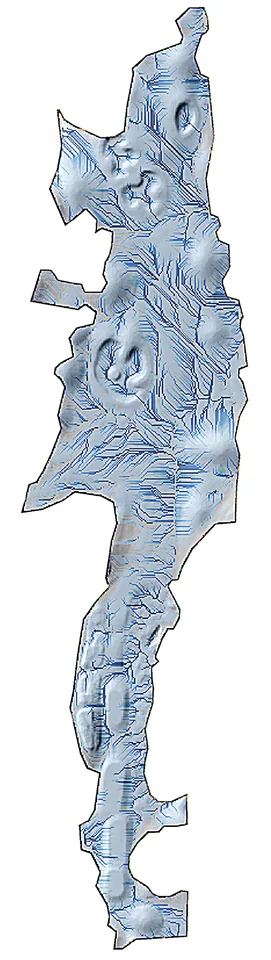
Drone-derived terrain models let us precisely detect and delineate closed drainage features and quantify their exact storage geometry — directly from a single flight, at a level of spatial detail no point-survey method can match. That’s a measurement capability, not a forecast: we can tell you the theoretical storage capacity of a low point on the course, which is useful for prioritizing which drainage features warrant a closer look. It’s not a substitute for soils data or a hydrology model, and we won’t frame it as one.
Marketing
The orthomosaic and 3D mesh model aren’t just maintenance tools — the same captures make for clean, high-resolution course marketing material: website imagery, membership materials, or a roaming fly-through video for a course tour.