Construction and Excavation

Know What Actually Moved, Down to the Cubic Meter.

Progress disputes, volume estimates, and as-built comparisons shouldn’t come down to someone’s best guess. We fly it, measure it, and show you the number.
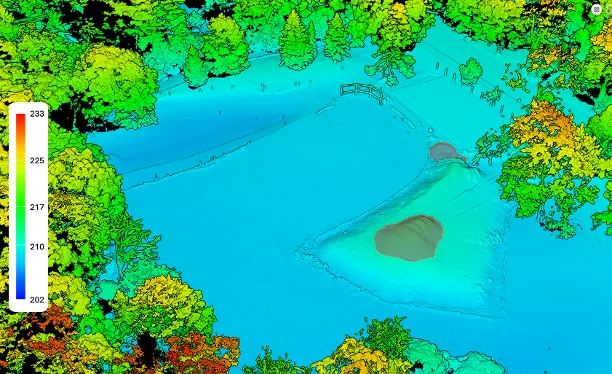
Elevation model of a park construction site showing surrounding tree canopy
FAA Part 107 Certified $1M Liability & E&O Insured

Construction sites generate constant questions that are expensive to get wrong: how much material actually moved this month, whether the grading is on-spec, whose estimate is right — yours or the sub’s. A repeatable data-collection flight with real ground control turns those into answered questions instead of arguments.

Progress / Change Detection

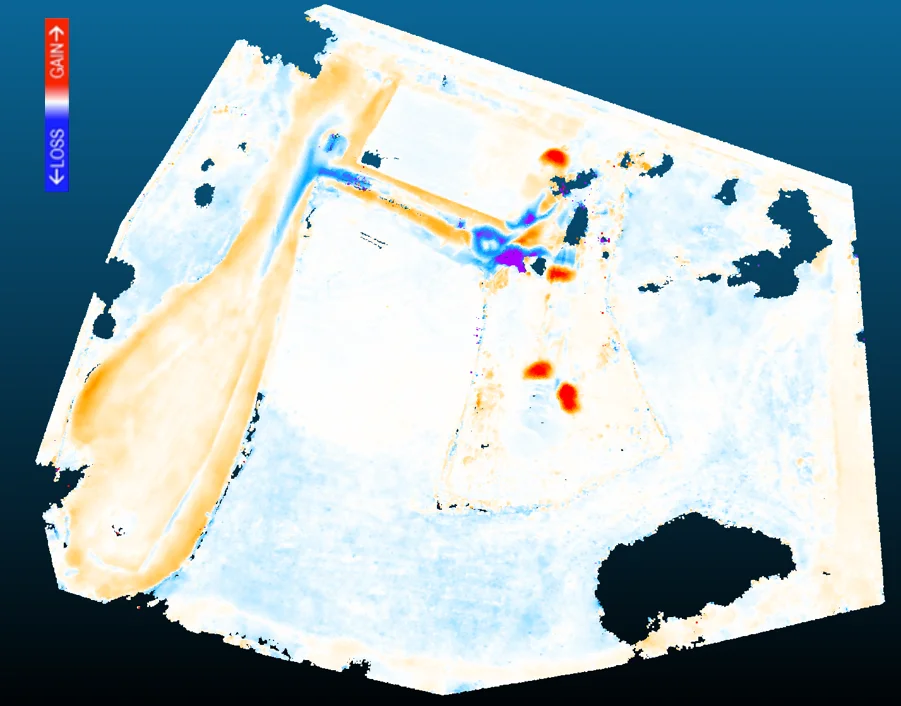
Time-series orthomosaics and a change-magnitude map between visits, so “what changed since last month” has a picture and a number, not just an impression.

Cut/Fill Volumetrics

Dated surface models compared visit-to-visit to produce a defensible cut/fill volume — flagged and excluded where obstructions like overhanging tree canopy would otherwise corrupt the number.

As-Built Compliance & Change Orders

As-built surface compared against the design plan, with a deviation map and a stated tolerance — the same comparison that backs up a change-order request. Not a substitute for a licensed land survey — a construction-monitoring product, and we’re clear about that boundary with every client.

RTK ground control, every flight. We use RTK ground control, not GPS-only positioning — the difference between “looks about right” and a number you’d defend in a progress meeting.

Real Data, In Progress

A live example from an active site

This isn’t a finished client deliverable — it’s real capture and real analysis from a park construction site we’re tracking over multiple visits. It updates as the site progresses and the dataset matures.
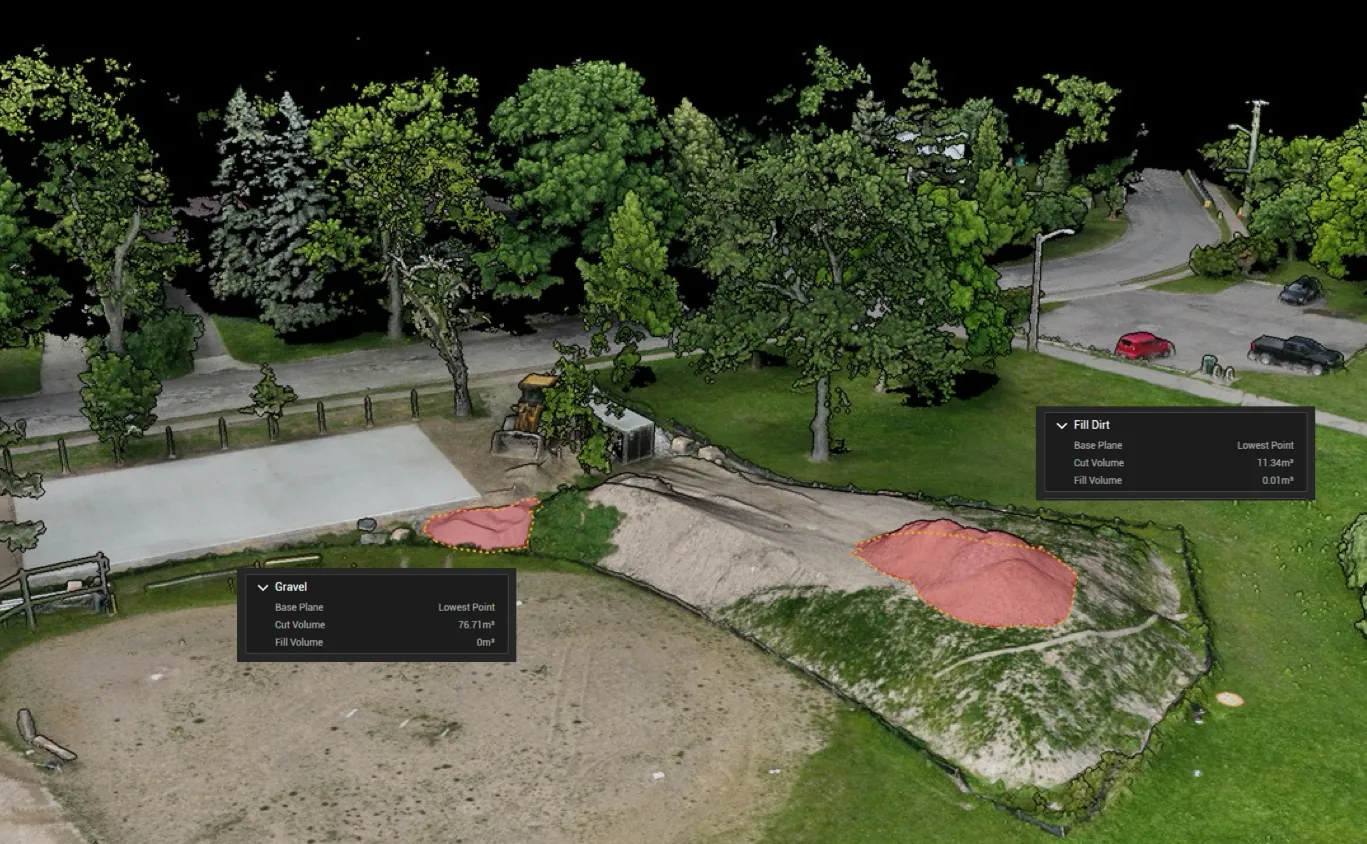
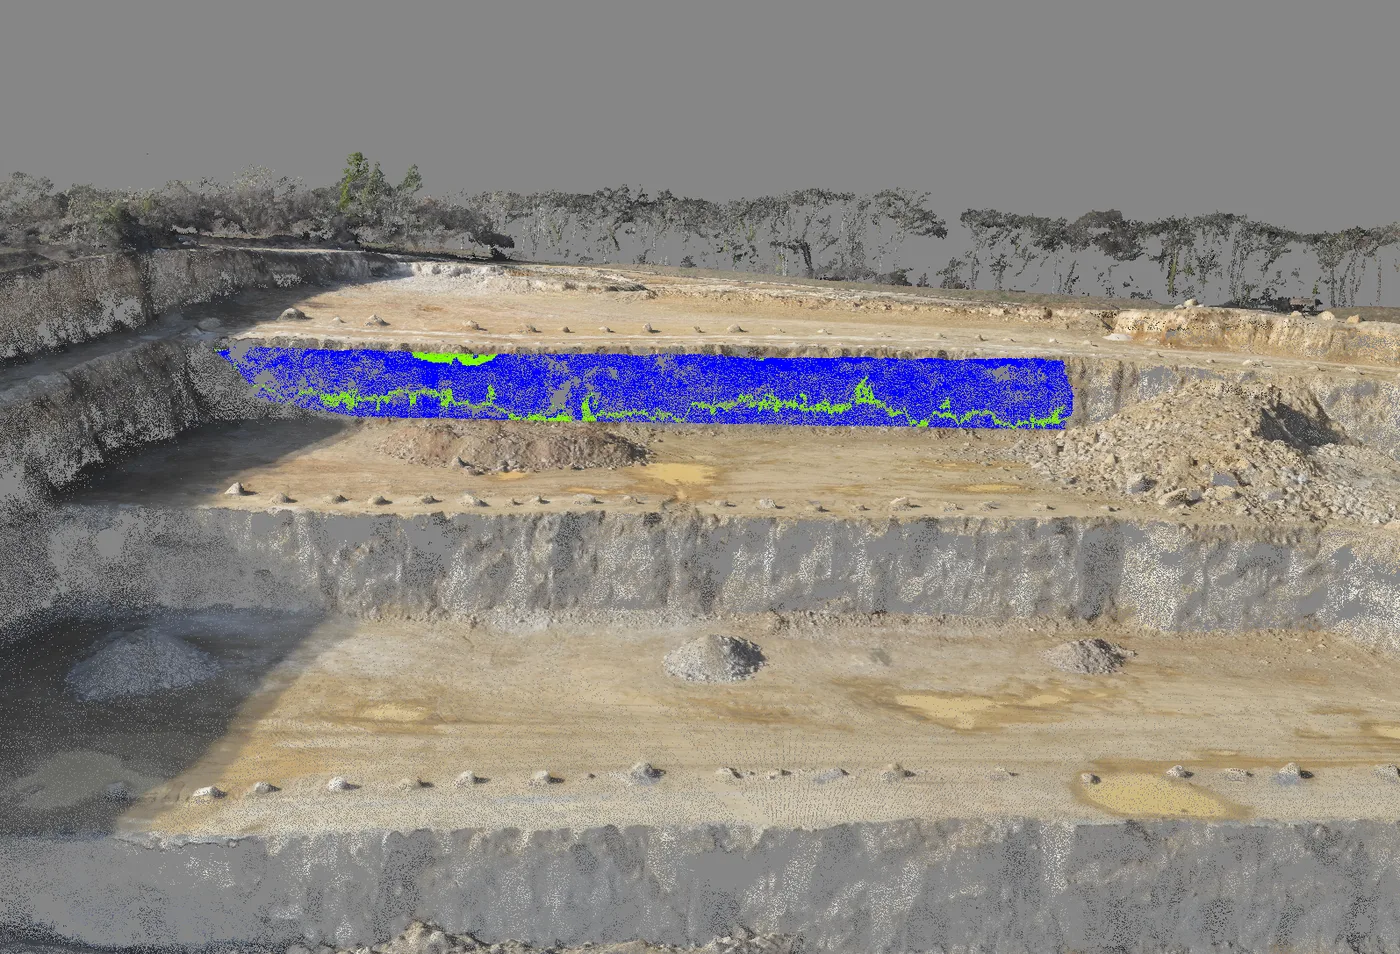
Point cloud model with cut and fill volume measurements labeled: 76.71 cubic meters cut on gravel, 11.34 cubic meters cut on fill dirt
Real capability demo
Measured cut/fill volumes from an actual visit — not a mockup.
Color-coded elevation model of the same site showing surrounding tree canopy excluded from analysis
Real capability demo
Elevation model of the same site — the tree canopy visible at the edges is exactly what gets excluded from the volume calculation.
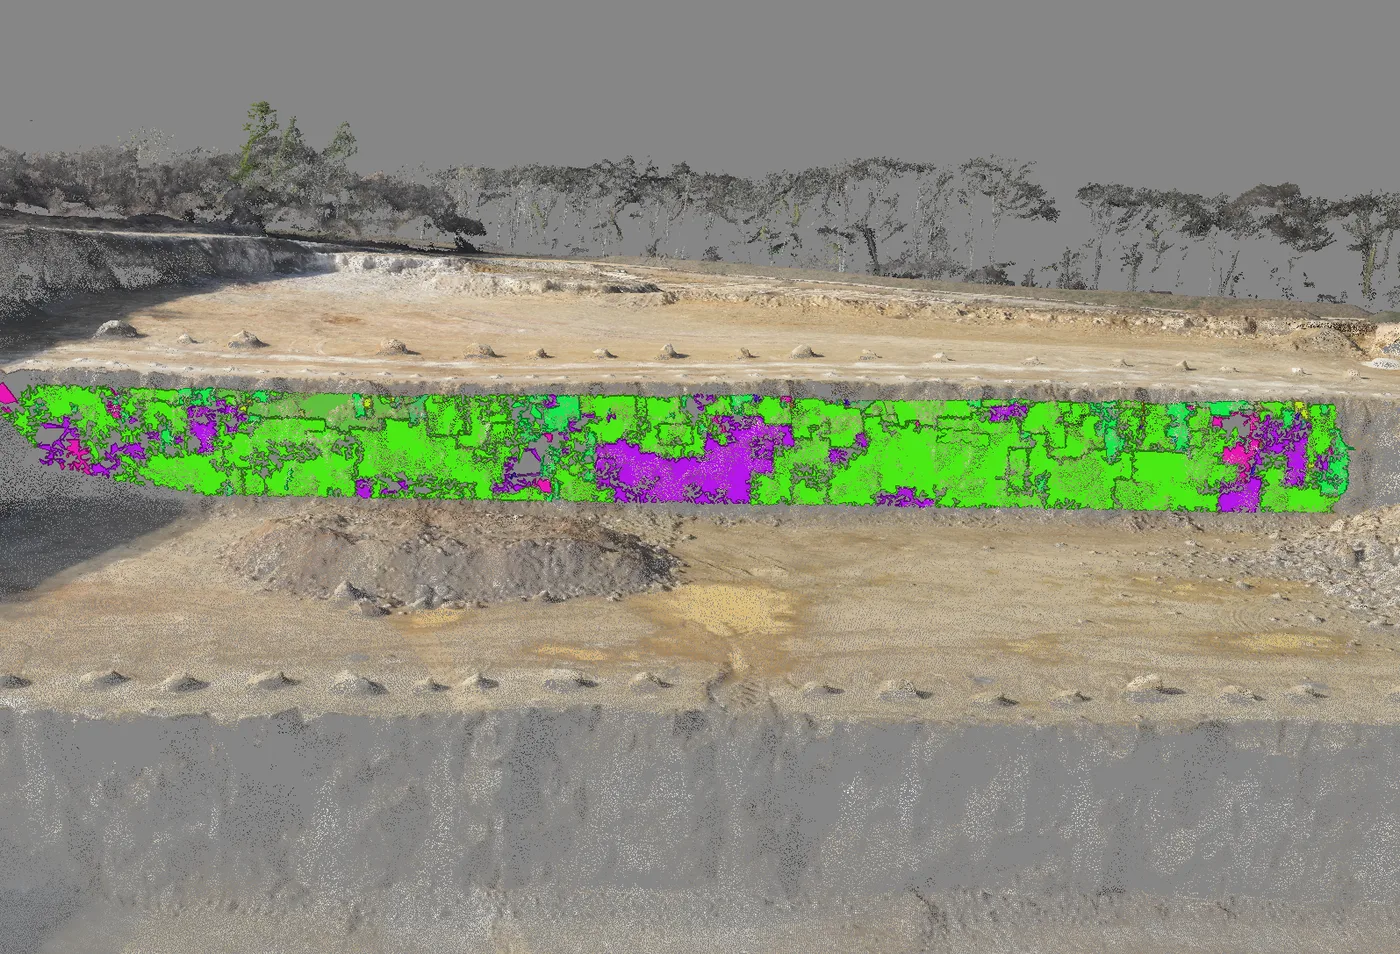
Change-magnitude map between two site visits showing areas of material gain and loss
Real capability demo
Change-magnitude map between two visits — gain and loss areas flagged automatically.

Precision Analysis, Applied

See Your Whole Site — Down to the Bench

A drone flight over a working quarry can produce a pretty flyover video, or it can produce a dataset accurate enough to measure bench angles, haul road grades, and turn radii to the centimeter. The difference is entirely in how the data is captured — dense, high-overlap imagery aimed at the faces themselves, not just a standard top-down mapping pass. Bench geometry, joint mapping, and haul-road engineering below are examples of the types of precision analysis Blue Nose Aerial Imaging – Huron Valley can deliver — the same measurement workflow applies to any site where geometry, grading, or access routes need to be verified rather than estimated, not just quarries.
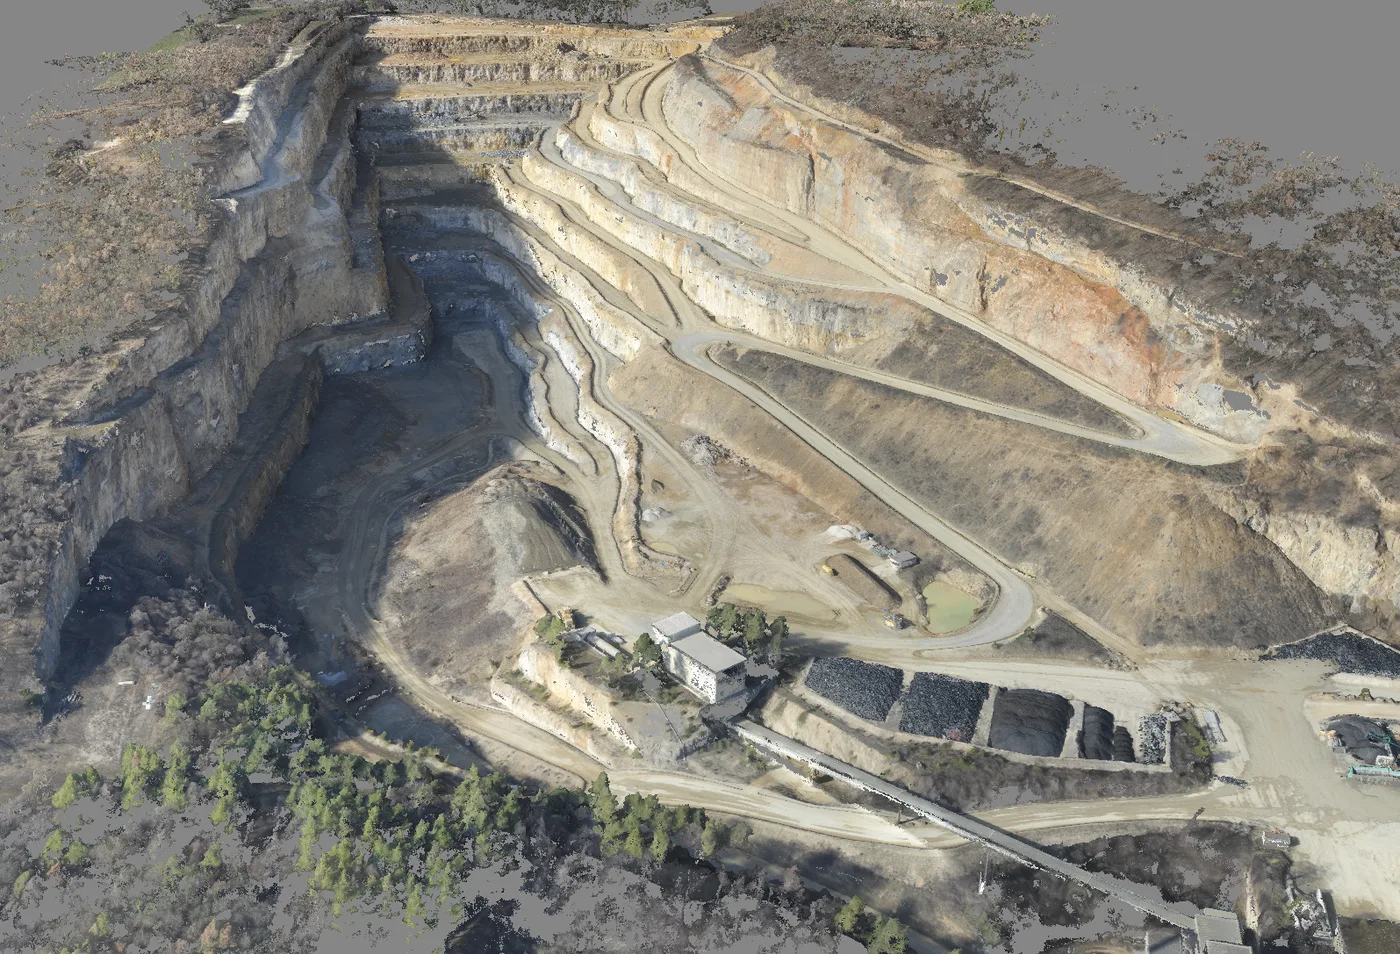
Complete 3D reconstruction of an active quarry site
One Flight, the Whole Site. A complete 3D reconstruction of an active quarry — every bench, haul road, stockpile, and structure, built entirely from overlapping drone imagery. Nothing here is sketched in or estimated; every surface is measurable.
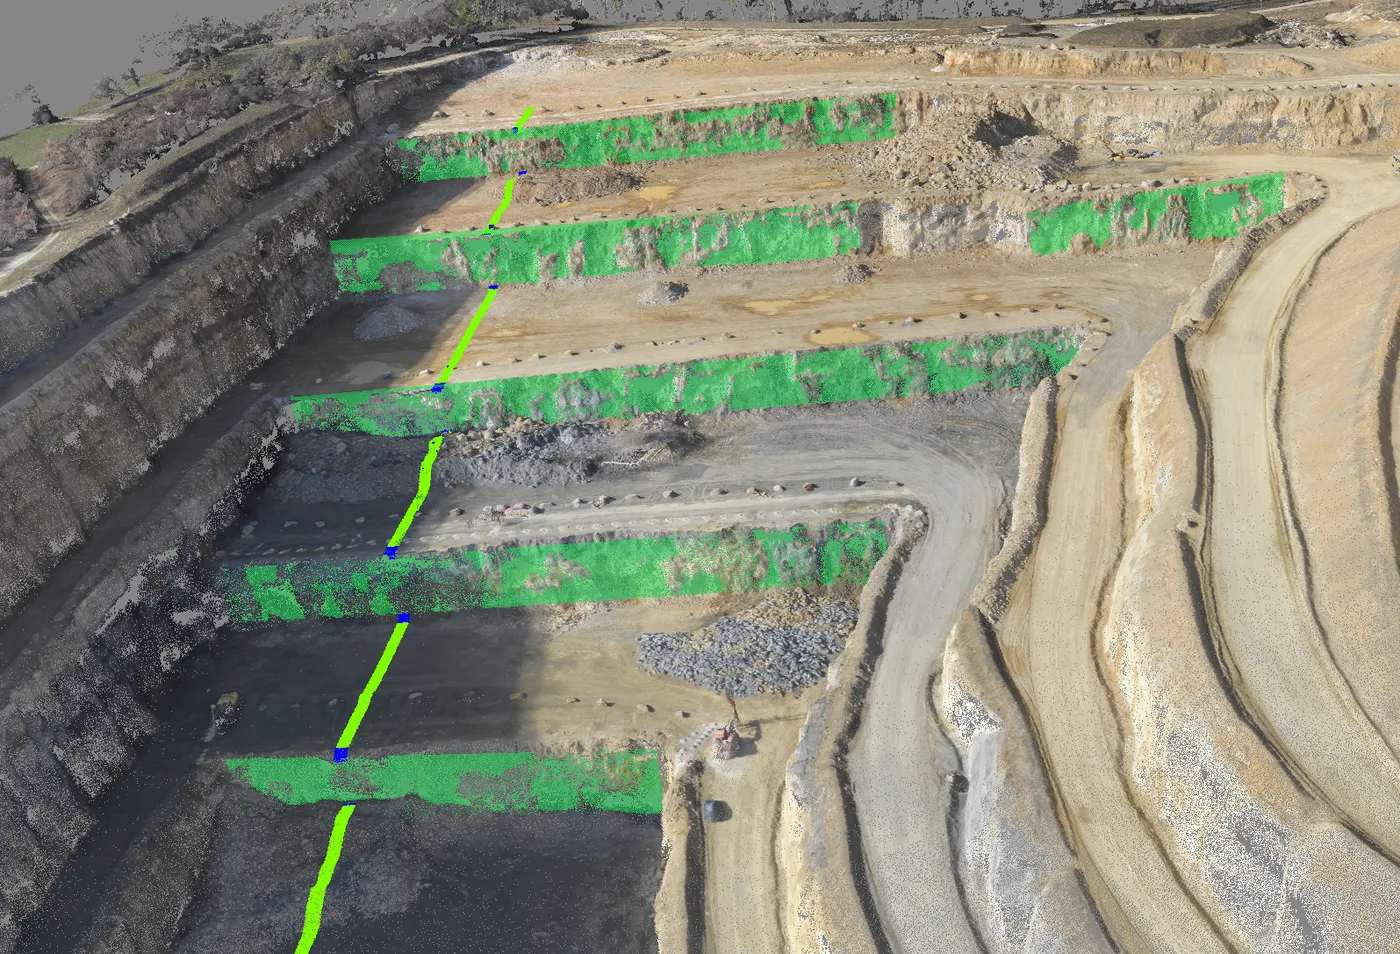
Bench staircase with a slope measurement line traced through the 3D data
Reading a Wall Like a Staircase. Quarry walls are cut in stepped benches, and the number that matters most for stability planning is the overall slope angle, traced directly through the 3D data, crest to toe — no one rappelling down the face to get it.
Bench-top patch isolated for a clean surface measurement
Precision Starts With a Clean Patch. Before reporting a bench height or width, we isolate a clean, rubble-free patch of the real surface rather than reading it off a rounded, debris-covered corner — the difference between a defensible number and a guess with a decimal point.
Classified facet map showing natural fracture and joint orientation across a rock face
Seeing the Structure in the Rock. Dense point-cloud data can reveal the orientation of natural fractures and joint sets running through a face, mapped across the entire wall — the same category of information a geotechnical review leans on, produced straight from the flight data.
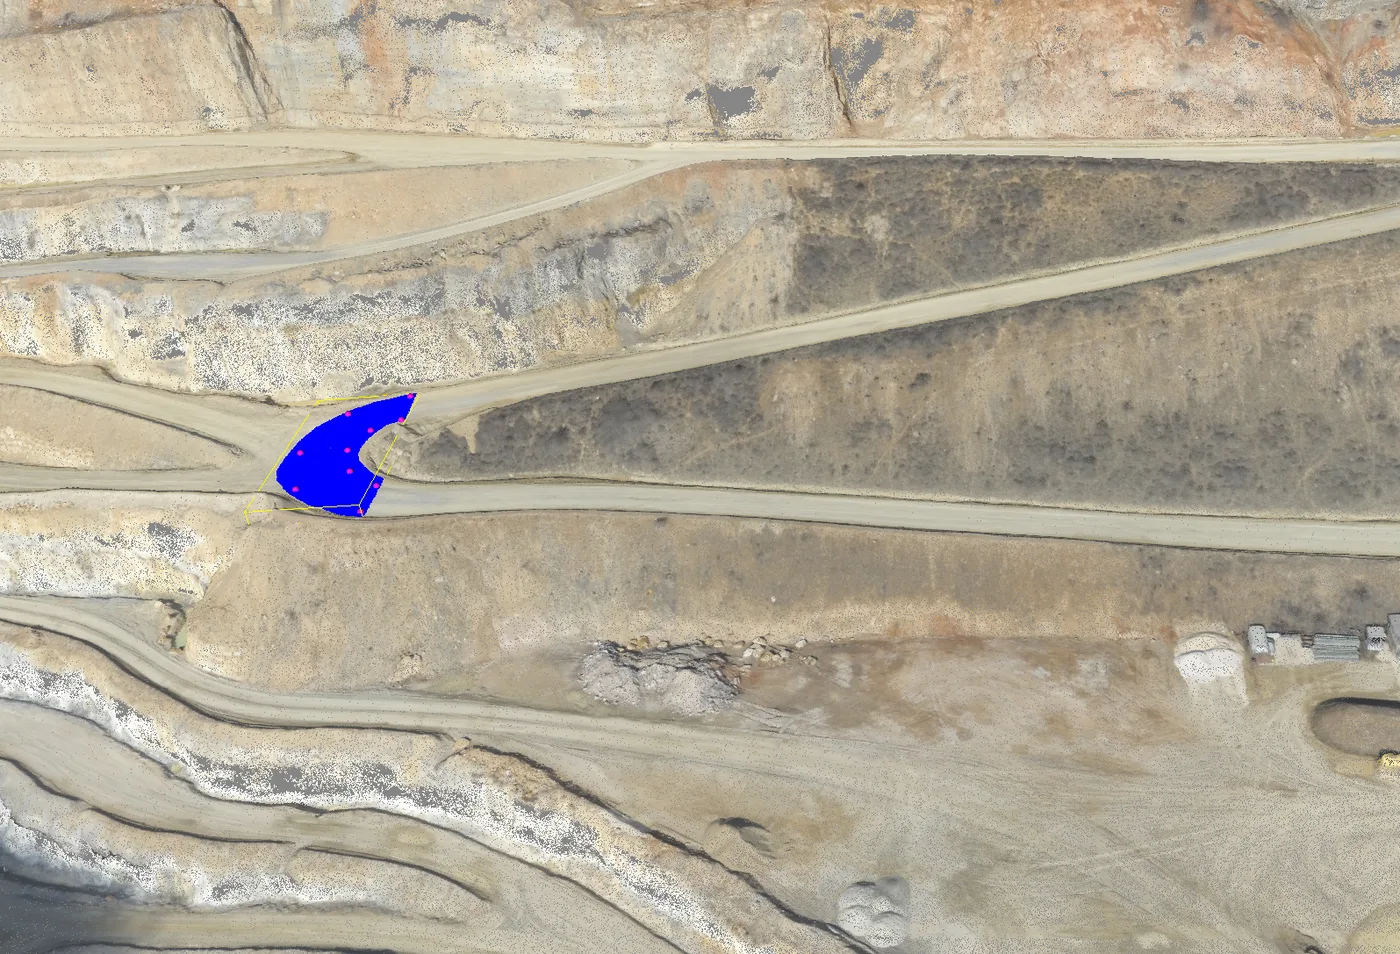
Haul road switchback isolated for grade, width, and turn-radius measurement
Every Curve, Measured. Haul roads get the same scrutiny as the walls — one switchback isolated for a full geometric read of grade, width, and turn radius through the curve. That’s the data that tells you whether a truck can actually make the turn.
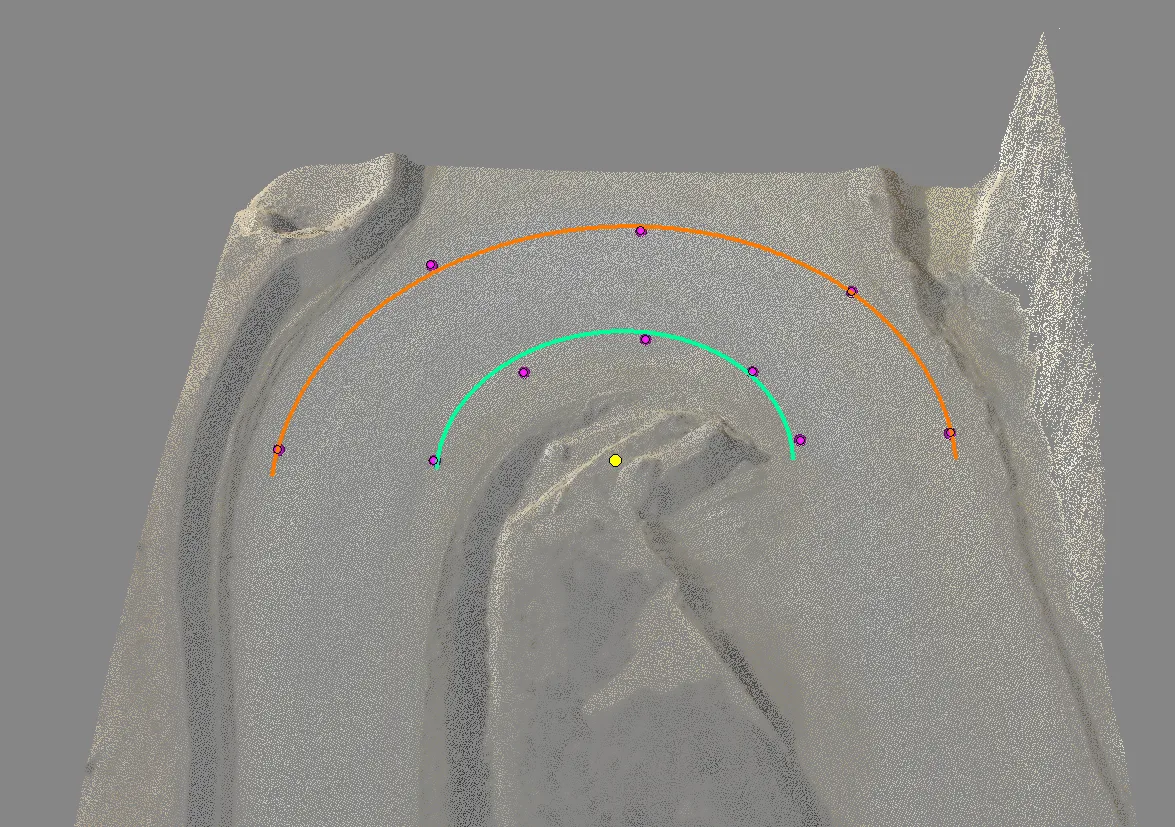
Fitted turn-radius overlay drawn back onto site imagery
The Number You Can Actually Use. The fitted turn geometry — inner edge, outer edge, common center — drawn back onto the site imagery so the result is legible to anyone, ready to hand to an operations manager or drop into a report.
Quarry roaming fly-through — the same captured data, in motion.

Site imagery courtesy of Pix4D / pix4d.com. All processing and analysis shown on this page — bench geometry, joint mapping, haul road engineering — was performed independently by Blue Nose Aerial Imaging – Huron Valley, using our own workflow.

Request a Site Flyover

Schedule a Consultation